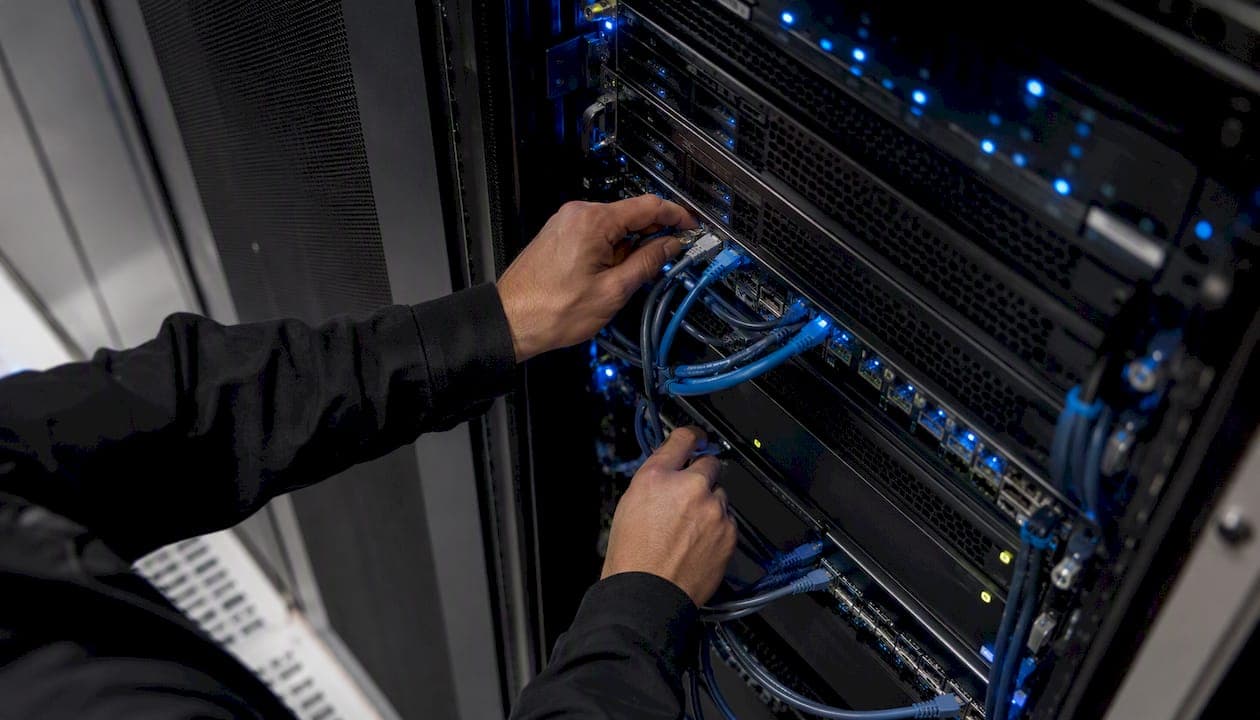
Log management is the governed lifecycle that collects, parses, stores, and ultimately disposes of machine-generated event data so your teams can monitor systems, investigate incidents, troubleshoot failures, and satisfy retention requirements. The seven-stage lifecycle runs: generate → collect/ship → parse/structure → store/index → retain/rotate → query/monitor → archive/delete. Two documents anchor any serious implementation: NIST SP 800-92 Rev. 1 for planning and governance, and RFC 5424 for the syslog message format and severity conventions.
- Generate: applications, hosts, containers, and network devices emit timestamped event records
- Collect/ship: agents or collectors forward those records to a central ingest point
- Parse/structure: raw text is broken into typed fields (timestamp, severity, service, message)
- Store/index: parsed records land in a searchable index or columnar store
- Retain/rotate: policies move records through hot, warm, and cold tiers
- Query/monitor: analysts and alerting rules interrogate the indexed data in near real time
- Archive/delete: records past their retention window are compressed to cold storage or purged
Key takeaways
Log management works best when it is treated as a governed programme with a defined lifecycle, clear ownership, and retention policies aligned to the strictest applicable requirement.
| Point | Details |
|---|---|
| Seven-stage lifecycle | Every log pipeline runs: generate, collect, parse, store, retain, query, and archive/delete. |
| Structure at source | Emit structured JSON from applications to eliminate costly downstream parsing and field loss. |
| Tier storage by age | Hot (0–30 days), warm (—), and cold (1 year+) tiers control cost without losing compliance coverage. |
| Align retention to strictest rule | Set retention windows to the most demanding applicable requirement (PCI DSS, HIPAA, OSFI, or provincial legislation). |
| Govern with a playbook | Follow NIST SP 800-92: maintain an inventory, define a target state, assign owners, and measure continuously. |
Table of Contents
- What is a log, and what types will you encounter?
- How the log-management lifecycle works, stage by stage
- What does a typical log-management architecture look like?
- Which tools and protocols should you know?
- Why does log management matter? Core use cases
- Log management best practices and governance
- How to build a practical log pipeline: an implementation checklist
- Where do log-management costs come from?
- Nexus-aligned operational playbook and roles
- A practitioner's perspective on where Canadian teams should start
- Sources
What is a log, and what types will you encounter?
A log entry is a timestamped, structured or semi-structured record of a discrete event: a process start, an authentication attempt, a packet drop, a database query. Each entry typically carries a timestamp, a severity level, a source identifier, and a message body. The source identifier might be a hostname, a container ID, or a service name, depending on the emitter.
The categories you will collect most often:
System logs record kernel events, daemon starts and stops, hardware errors, and OS-level state changes. On Linux these flow through the journal or /var/log/syslog; on Windows they appear in the Event Log.
Application logs are emitted by your own code or third-party software. Quality varies enormously: a well-instrumented microservice emits structured JSON with a trace ID; a legacy monolith might write free-form text that requires heavy regex parsing later.
Security and audit logs capture authentication events, privilege escalations, policy changes, and access-control decisions. These are the records auditors ask for first.
Network logs come from firewalls, routers, load balancers, and VPN gateways. They document traffic flows, connection states, and rule matches.
Container and runtime logs are written to stdout/stderr by containerised workloads and collected by a node-level agent before the container is recycled.

Access and authentication logs overlap with security logs but are worth treating separately because they feed identity-centric correlation rules.
Here is the practical difference between a plain-text syslog line and a structured JSON entry:
Plain-text syslog (RFC 5424 format):
<34>1 2025-11-14T12:00:00Z web01 nginx - - - GET /api/health 200 142
Structured JSON:
{"ts":"2025-11-14T12:00:00Z","host":"web01","svc":"nginx","method":"GET","path":"/api/health","status":200,"bytes":142}
The JSON version is machine-parsable without a regex. Fields are typed, named, and ready for indexing the moment they arrive. JSON's key-value structure is why most modern observability stacks default to it: downstream parsing work drops to near zero, and field cardinality is predictable.
Pro Tip: Emit structured logs at the source. Retrofitting structure at the collector costs CPU, introduces parsing bugs, and can silently drop fields that correlation rules depend on later.
How the log-management lifecycle works, stage by stage
Understanding log management at the stage level is what separates teams that react to incidents from teams that prevent them. Here is what actually happens at each step.
-
Generate. Every host, application, container, and network device emits events. The quality of what you emit here determines everything downstream. Use language SDKs (the standard library logger in Go, Python's
loggingmodule, Log4j in Java) and instrument at meaningful boundaries: request entry, auth decision, error path, external call. OpenTelemetry SDKs let you attach trace context to log records, which makes cross-service correlation possible later. -
Collect/ship. A lightweight agent or collector reads those records and forwards them to a central ingest point. OpenTelemetry Collector and Fluent Bit are the two most common choices here. Fluent Bit is particularly well-suited to constrained environments (Kubernetes node agents, edge devices) because its memory footprint is small. The collector's job is to buffer, batch, and route, not to parse heavily.
-
Parse/structure. Incoming records are broken into typed fields. If you emitted JSON at source, this stage is trivial: the collector deserialises the payload. If you emitted plain text, you need a grok pattern or a regex to extract timestamp, severity, and message fields. Parse early. Parsing only at query time risks losing fields that alerting rules need to fire correctly.
-
Store/index. Parsed records land in a storage backend. A full-text search index (like the one Splunk or Dynatrace use internally) gives fast free-text queries but costs more per GB. A columnar store (ClickHouse, for example) compresses repetitive log fields aggressively and handles analytical queries well. Object storage (S3-compatible) is cheapest but slowest to query. Most mature pipelines use all three in tiers.
-
Retain/rotate. Policies define how long records stay in each tier before moving. A 30-day hot window covers most active investigations. Older records move to warm storage at lower cost. Records past the compliance window are deleted or cryptographically purged. Rotation is not just housekeeping: it preserves evidentiary usability and must be handled carefully to avoid altering forensic material.
-
Query/monitor. Analysts run ad-hoc searches; alerting rules run continuously against the indexed stream. Datadog's log analytics, Splunk's SPL, and Dynatrace's DQL all sit at this layer. The key design decision is latency: how quickly after emission does a record need to be queryable? For security monitoring, seconds matter. For compliance archiving, minutes are fine.
-
Archive/delete. Records past their retention window move to cold object storage or are deleted. Cryptographic deletion (key destruction for encrypted archives) is the cleanest way to satisfy right-to-erasure requirements. Automated TTL policies enforce this without manual intervention.
Pro Tip: Set TTLs in your storage layer, not in a cron job. Table-level TTL policies in ClickHouse or index lifecycle policies in your search backend enforce deletion reliably even when the ops team is busy.
What does a typical log-management architecture look like?
The architecture that NIST describes maps cleanly to three tiers. Each tier has a distinct responsibility.
Tier 1: Log generation Every host, application, container, and network device. This tier produces the raw material. The design goal here is completeness and consistency: every service emits logs in a known format, with a timestamp in UTC, and a severity level that matches RFC 5424's 0–7 scale.
Tier 2: Collection, aggregation, and storage
- Agents run on each host and tail log files or read from the journal. Fluent Bit and the OpenTelemetry Collector are the standard choices.
- Agentless collection uses syslog receivers or API polling. Useful for network devices that cannot run an agent.
- Relays/aggregators fan-in from many agents to a smaller number of ingest endpoints, handling buffering and back-pressure.
- Indexers and columnar stores receive parsed records and make them queryable. Splunk's indexer tier, Datadog's ingest pipeline, and Dynatrace's log ingest all operate here.
- Object storage (AWS S3, Azure Blob, Google Cloud Storage) holds warm and cold tiers at low cost.
Tier 3: Monitoring consoles and downstream consumers Dashboards, alerting engines, and analyst workbenches sit here. SIEMs (Security Information and Event Management platforms) are downstream consumers of the log pipeline, not replacements for it. A SIEM applies correlation rules and threat-intelligence enrichment to log data it receives from Tier 2. If your pipeline is broken, your SIEM is blind. For more on how SIEMs connect to broader security orchestration workflows, the distinction matters operationally.
Deployment options:
- On-premises: full control, higher operational burden, suits regulated environments with data-residency requirements
- SaaS: Datadog, Dynatrace, and Splunk Cloud offload infrastructure management; ingest pricing scales with volume
- Hybrid: hot tier on-prem or in a managed cloud region, cold tier on object storage; common in Canadian healthcare and financial services
For cloud-specific logging controls and retention considerations, the architecture choices shift depending on whether workloads run on AWS, Azure, or Google Cloud.
Which tools and protocols should you know?
The tooling landscape maps directly onto lifecycle stages. Here is what matters and where each piece fits.
Protocols and standards
- Syslog (RFC 5424): the universal message format. Defines facility codes, severity 0–7, structured data elements, and the
HOSTNAME APP-NAME PROCID MSGIDheader fields. Nearly every device and OS can emit syslog. - Syslog UDP transport (RFC 5426): the original UDP mapping. RFC 5426 documents the reliability trade-offs clearly: UDP datagrams can be lost or reordered, there are no acknowledgements, and message size limits apply. Use TLS syslog (RFC 5425) in any environment where log integrity matters.
- OpenTelemetry: the CNCF standard for traces, metrics, and logs. The OpenTelemetry Collector acts as a vendor-neutral pipeline component that can receive, process, and export to multiple backends simultaneously.
- JSON structured logs: not a protocol, but a de-facto format standard. Pair with OpenTelemetry's log data model for maximum portability.
Collectors and agents
- OpenTelemetry Collector: vendor-neutral, extensible, supports receivers for syslog, OTLP, Fluent Forward, and more. The right choice when you want to avoid vendor lock-in at the collection layer.
- Fluent Bit: lightweight C-based agent, excellent for Kubernetes DaemonSets and resource-constrained hosts. Handles buffering, filtering, and routing with low overhead.
- Fluentd: the heavier Ruby-based predecessor to Fluent Bit; richer plugin ecosystem, higher memory use.
- Host agents (Datadog Agent, Dynatrace OneAgent, Splunk Universal Forwarder): vendor-specific agents that bundle log collection with metrics and APM. Convenient but create coupling to a single vendor's backend.
Storage backends A full-text search index gives sub-second free-text queries but costs more per GB at scale. A columnar store like ClickHouse compresses repetitive log fields aggressively and handles time-range analytical queries efficiently. Object storage is cheapest but requires a query layer (Athena, DuckDB, or similar) to be useful. Most production pipelines tier across all three.
SIEM vs. log management A SIEM is a security-focused analytics layer that consumes log data. It applies correlation rules, threat intelligence, and case management on top of a log pipeline. Log management is the pipeline itself. Running a SIEM without a governed log pipeline underneath it is like running a database without a storage layer.
Why does log management matter? Core use cases
The benefits of log management are most visible when something goes wrong, but the value accumulates continuously.
- Incident investigation and forensics: a complete, tamper-evident log trail lets you reconstruct exactly what happened, in what order, and from which source. Without it, post-incident analysis is guesswork. A well-maintained audit trail is often the difference between a closed ticket and an unresolved breach.
- Troubleshooting performance issues: correlating application error rates with infrastructure metrics via shared timestamps and trace IDs cuts mean time to resolution. Teams that centralise logs reduce the back-and-forth between application and infrastructure owners.
- Security monitoring: continuous log ingestion feeds detection rules that fire on anomalous authentication patterns, lateral movement indicators, or data-exfiltration signals. Near-real-time alerting depends on a healthy ingest pipeline.
- Compliance and audit evidence: PCI DSS, HIPAA, SOC 2, and ISO 27001 all require demonstrable log retention and access controls. Auditors ask for specific event types over specific windows. A governed pipeline produces that evidence on demand rather than in a scramble.
- Capacity planning and business metrics: aggregate log data reveals traffic patterns, error rates by service, and resource saturation trends. These signals feed capacity decisions before a service degrades.
The distinction between monitoring (a near-real-time consumer of the live log stream) and log management (the governed pipeline that stores, retains, and eventually disposes of records) matters for architecture. Monitoring tools like Dynatrace and Datadog operate at the query layer; the pipeline underneath them is what makes their data reliable and complete.
Log management best practices and governance
NIST SP 800-92 frames log management as a planning discipline, not a tooling decision. The guidance is explicit: define a target state and a playbook, then work toward it continuously. Ad-hoc "collect everything forever" approaches create cost problems and compliance gaps simultaneously.
Here are the governance practices that matter most:
- Maintain a log-source inventory. List every system that should emit logs, what it emits today, and the gap between the two. Without an inventory, you cannot know what you are missing.
- Define retention requirements before you deploy. Set retention to the strictest applicable regime. If PCI DSS requires 12 months of audit history and your internal policy requires 90 days, PCI DSS wins. If HIPAA applies to any part of your environment, security documentation retention can extend to six years. Align your hot/warm/cold tiers to those windows.
- Classify logs by use case. Security and audit logs need the longest retention and the strictest access controls. Debug logs from a development environment need neither. Classify first, then apply storage and access policies by class.
- Assign owners and review cadences. Each log source should have a named owner responsible for format, volume, and retention compliance. Review the inventory quarterly.
- Use TLS transport. As RFC 5426 warns, UDP syslog offers no delivery guarantees and no confidentiality. Use RFC 5425 (TLS syslog) or an encrypted collector transport for anything that carries sensitive event data.
- Filter and sample at the collector, not at the source. Suppress high-volume, low-value records (health-check pings, routine polling) at the collector before they reach the indexer. This reduces ingest cost without losing coverage on meaningful events.
- Enforce TTLs automatically. Manual deletion is error-prone. Table-level TTL policies or index lifecycle management rules enforce retention windows reliably.
Key governance principle: treat log management as a managed programme with a defined playbook and measurable target state. A pipeline with no inventory, no retention policy, and no owner is not a log-management programme. It is a liability.
For Canadian organisations, align retention to the strictest applicable federal or provincial requirement alongside any sector-specific framework (PIPEDA, provincial health privacy legislation, OSFI guidelines for financial institutions). The role of IT in enterprise resilience is directly tied to how well these retention and recovery controls are documented and tested.
How to build a practical log pipeline: an implementation checklist
A working pipeline does not require perfection on day one. Start narrow, prove the model, then expand.
Example pipeline (concrete components):
App (structured JSON) → Fluent Bit (per-host agent) → OpenTelemetry Collector (central ingest) → Parser/enrichment → ClickHouse or Splunk (hot index) → Object storage (warm/cold) → Datadog or Dynatrace (dashboards and alerts)
Quick-start checklist:
- Instrument your five most critical services with structured JSON logging. Add a
trace_idfield if you run distributed workloads. - Deploy Fluent Bit as a DaemonSet (Kubernetes) or a systemd service (bare metal/VM) on a representative subset of hosts. Validate that records arrive at your central ingest point with correct timestamps and fields.
- Define a 30-day hot retention policy in your index or columnar store. Set a TTL rule to enforce it automatically.
- Create one baseline dashboard covering error rate, request latency, and authentication failures for the instrumented services.
- Write one incident playbook that references log queries. A playbook that says "run query X to confirm lateral movement" is far more useful than one that says "check the logs."
- Add warm and cold tiers once the hot tier is stable. Move records older than 30 days to a cheaper columnar or object-storage tier.
Operational health monitoring: Watch your pipeline the same way you watch your applications. Track dropped messages at the collector (Fluent Bit exposes these as metrics), monitor queue depth at the ingest point, and set an alert on backpressure events. A pipeline that silently drops records during a traffic spike is worse than no pipeline, because it creates false confidence.
Pro Tip: Before expanding collection to every service, validate end-to-end latency from emission to queryability on your pilot set. A 5-minute ingest lag that you discover during an incident is a much bigger problem than one you find during a calm test.
For a broader view of how log-based investigations feed into enterprise incident response, the playbook connection is worth formalising early.
Where do log-management costs come from?
Cost in a log pipeline is almost always a function of four variables: how much you ingest, how long you keep it, how finely you index it, and how often you query it.
Primary cost drivers:
- Ingest volume: SaaS platforms like Datadog and Splunk price primarily on GB ingested per day. High-cardinality debug logs from a busy service can dominate your bill.
- Retention window: longer retention means more storage. The relationship is linear unless you tier aggressively.
- Indexing granularity: full-text indexing every field is expensive. Indexing only high-value fields (timestamp, severity, service, trace ID) and storing the rest as raw compressed payload cuts index size significantly.
- Query frequency and complexity: heavy analytical queries on large time ranges consume compute. Columnar stores handle these better than inverted-index stores.
- Egress and retrieval: retrieving records from cold object storage incurs retrieval fees and latency. Design your tiers so that the records you query most often stay in the hot tier.
Practical tiering example:
Columnar compression is the fastest single lever for reducing storage cost on structured logs. ClickHouse, for example, applies LZ4 or ZSTD compression column-by-column, which works extremely well on log data because fields like severity, service, and status_code repeat constantly. Combine that with structure-at-source (so fields are typed, not embedded in a string) and TTL-based tiering, and storage costs compound downward.
Nexus-aligned operational playbook and roles
A log-management programme needs owners, not just tools. The plays below follow NIST SP 800-92's planning framework.
Step-by-step plays:
- Play 1 — Update inventories: audit every log source, confirm format and volume, and record gaps.
- Play 2 — Define target state: document what "good" looks like: which sources are covered, at what retention, with what access controls.
- Play 3 — Identify gaps: compare current state to target state. Prioritise by risk (security and audit logs first).
- Play 4 — Develop a mitigation plan: assign owners, set deadlines, and define success criteria for each gap.
- Play 5 — Implement and measure: deploy changes, validate coverage, and track pipeline health metrics continuously.
Roles and responsibilities:
| Role | Responsibility | Cadence | Expected output |
|---|---|---|---|
| Security team | Define retention requirements, review audit logs, own SIEM rules | Weekly / per incident | Retention policy, alert tuning notes |
| Platform / DevOps team | Deploy and maintain collectors, manage storage tiers, enforce TTLs | Monthly / on change | Pipeline health report, TTL audit |
| Compliance owner | Map retention to regulatory requirements, produce audit evidence | Quarterly / on audit | Compliance evidence package |
| Application owners | Instrument services, maintain log format documentation | Per release | Structured log schema, runbook updates |
AccountNext-Nexus provides 24/7 managed monitoring and retention enforcement, which removes the operational burden of pipeline health monitoring, TTL management, and compliance evidence generation from in-house teams. For organisations that cannot staff a dedicated log-operations function, a managed provider covers the platform and compliance layers while your team focuses on application instrumentation and incident response. Explore Nexus IT and cybersecurity services to see how that model works in practice.
A practitioner's perspective on where Canadian teams should start
Most teams I advise underestimate how much of their log-management problem is a governance problem, not a tooling problem.
Start with inventory and intent. Pick your five most critical services, define what you need to know from their logs, and emit structured JSON from day one. Set a 30-day hot window with a TTL rule that enforces itself. That alone puts you ahead of most organisations.
For Canadian teams, the compliance dimension is non-negotiable. Align your retention to the strictest rule that applies to your environment, whether that is PIPEDA, provincial health privacy legislation, or a sector-specific framework like OSFI. "We kept everything for 90 days" is not an answer when an auditor asks for 12 months of authentication events.
If your team cannot staff 24/7 pipeline monitoring and retention enforcement, a managed provider is worth the conversation. The cost of a missed retention gap or a silent pipeline failure during an incident almost always exceeds the cost of the service contract.
Sources
- SP 800-92 Rev. 1, Cybersecurity Log Management Planning Guide | CSRC
- RFC 5424: The Syslog Protocol
- What is log management? — ClickHouse engineering
- JSON (JavaScript Object Notation)